|
Public outreach
Lezioni divulgative
|
|
|
|
|
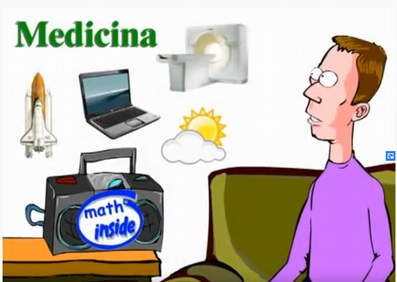
| Matematica e tumori (anche sul sito Maddmaths). |
Sand remediation strategies (italiano) |
Sand remediation strategies (english with arab subtitles) |
Seminario Scuole Accademia dei Lincei (2015) |
|
Lectures
Seminari registrati
|
|
|

|
|
| Wroslaw (2018) |
CIMPA (2016) |
Aachen (2012) |
CIRM (2018) |
|
Cell Motion
Moto di cellule
|
|
|
|
|
|
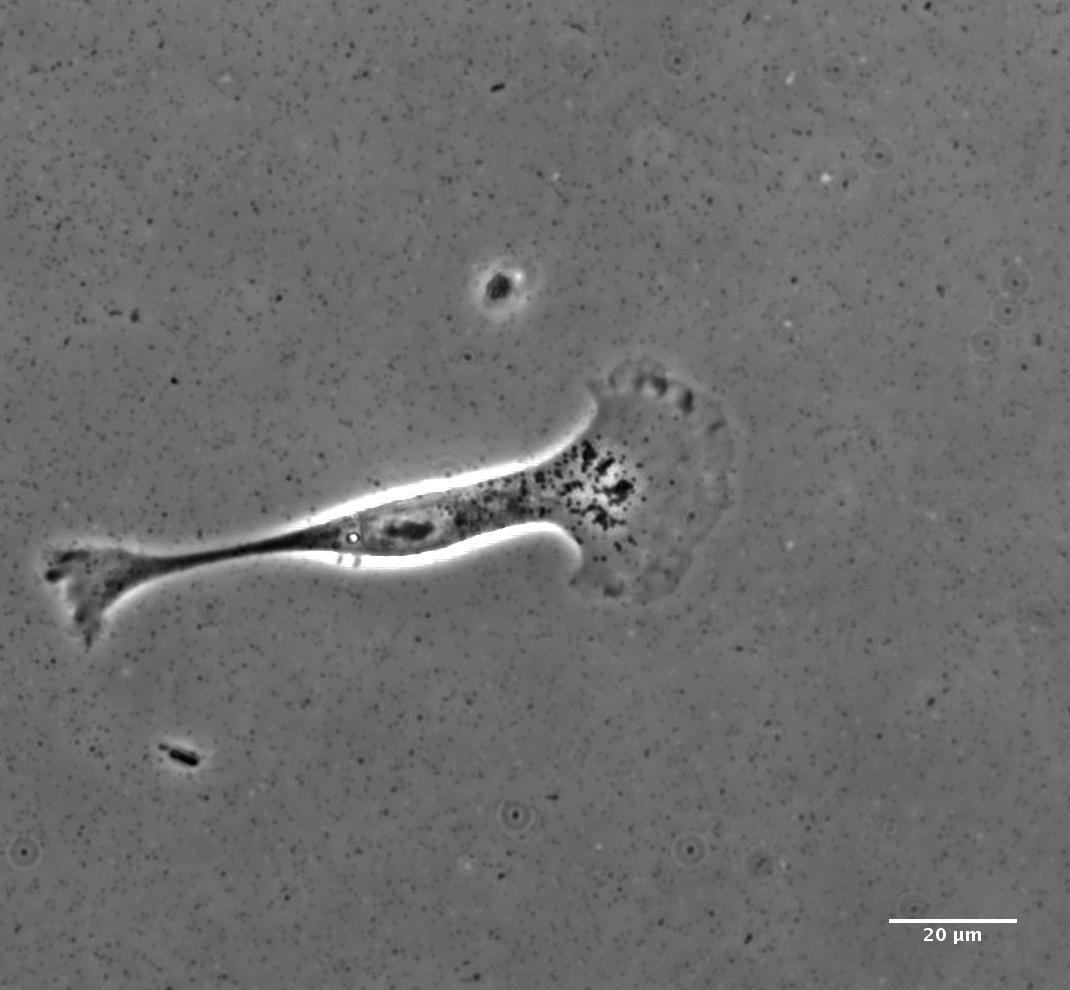
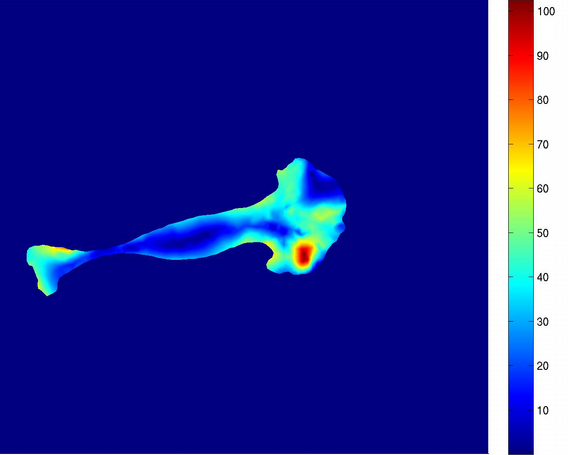
Evaluation of cell traction forces by traction force microscopy starting from images or videos of substrate deformation detected tracking small beads dispersed in it.
(
more info, see also
this and
this ).
|
|
|
|
|
|
Simulation of wound-healing assay of two masses of 120 ARO cells by a Cellular Potts Model
(more info).
|
Cell motion by a compartimentalized Cellular Potts Model.
(more info).
|
Invasion of a ovarian tumour cell through the mesothelium
(more info).
|
Invasion of a multicellular spheroid of an ovary tumour through the mesothelium (more info).
|

|
|
|
|
|
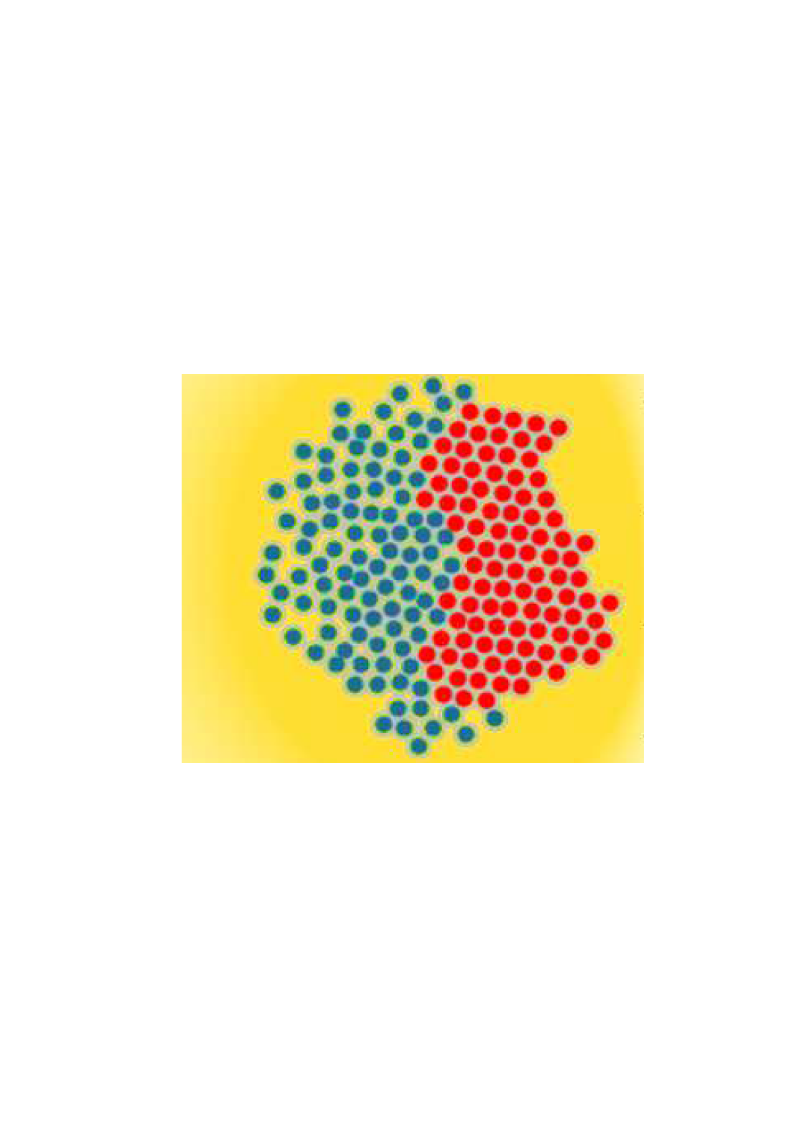
Simulation of contact inhibition of locomotion of a crest cell (in blue) getting closer to a placode cell (in red).
(more info).
|
Simulation of motion of an aggregate of crest cells (in blue) attracted by a chemoattractant (in yellow) produced by placode cells
(in red) without contact inhibition of locomotion.
(more info).
|
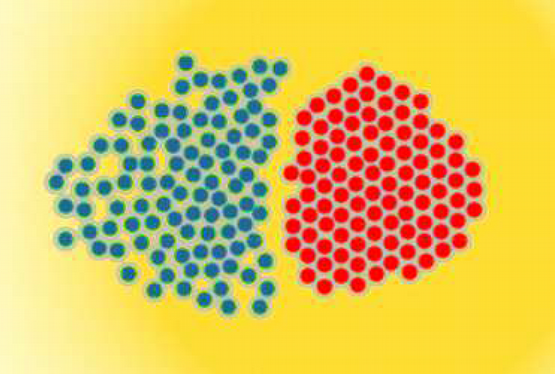
Simulation of the chase and run behaviour of an aggregate of crest cells (in blue) and an aggregate of placode cells
(in red) due to contact inhibition of locomotion.
(more info).
|
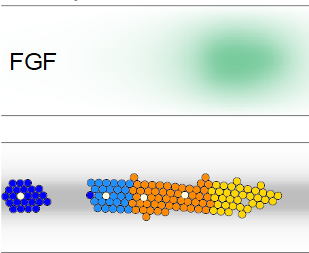
Morphogenesis of zebrafish posterior lateral line.
(more info).
|
|
|
|
|
|
Durotaxis by a nonlocal kinetic model. Cells initially in a softer region (bottom half) sense non locally the presence
of a stiffer ECM in the top half of the domain and migrate there.
(more info).
|
Motion of cells along virtual fibronectin stripes (identified by white lines in the figure) by a nonlocal kinetic model.
Cells in regions lacking of adhesion sites attach to the stripes and move towards and along them.
(more info).
|
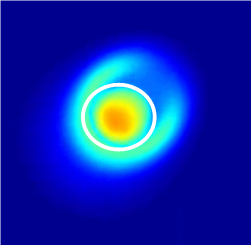
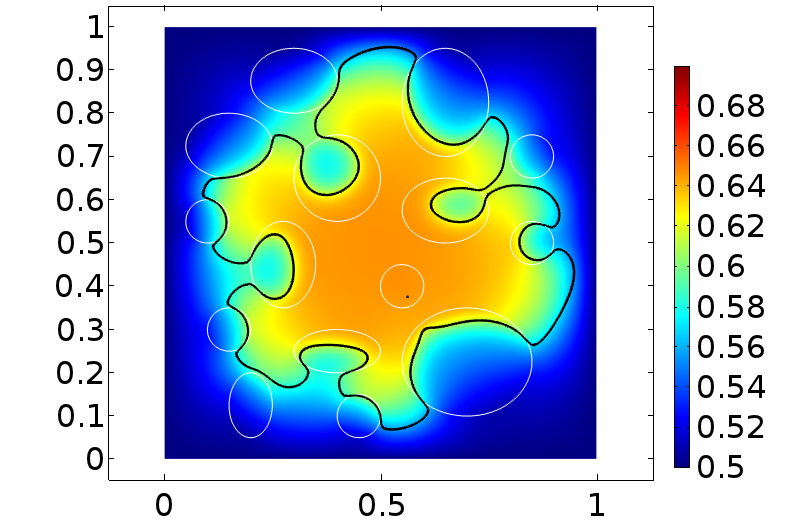
Cluster of cells chemo-attracted towards the top-right corner encountring a region (within the white circle in the figure) with denser ECM that slows them down.
(more info).
|
Cluster of cells chemo-attracted towards the top-right corner going around a region (within the white circle in the figure) with a too dense ECM that represent a physical limit of migration.
(more info).
|
|
|
Aggregation of separated cell clusters due to cell-cell adhesion by a non local kinetic model.
(more info).
|
|
Vascular Networks
Sviluppo di reti vascolari
|
|
|
|
|
|
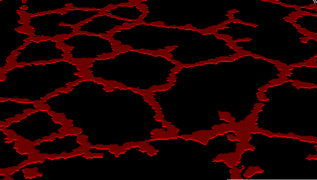
First moments of the formation of a capillary network by human microvascular endothelial cells plated
(125 cells/mm2) on Matrigel
(more info). Contact me for a
longer version (too big to be put on the web).
|
Effect of the interaction with the Matrigel on the process of formation of the capillary network by
vasculogenesis (more info).
|
Formation of a vascular network simulated by a cellular Potts model
(more info).
|
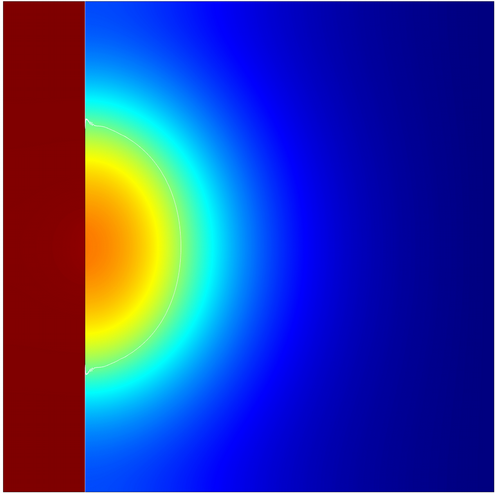
Growth of a tumor on a vascular network. Distribution of oxygen. The line represents the tumor border.
(more info).
|
|
Tumour Growth
Modelli di crescita tumorale
|
|
|
|
|
|
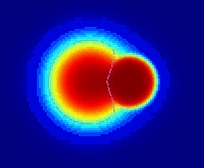
Growth of two colonies of WiDr cell lines which differ in their motility. Evolution of the volume ratio
(more info).
|
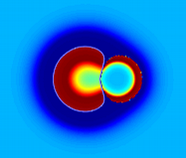
Growth of two colonies of WiDr cell lines which differ in their motility. Focus on where growth and death occurs (more info).
|
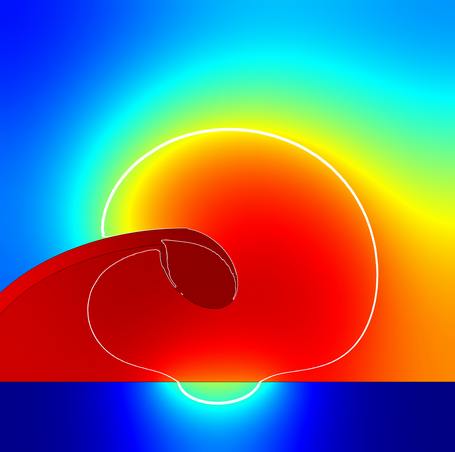
Tumour growth in a duct (on the left) . Its basal membrane is less dense in the central part and the tumour invades the outside passing through it. The line represents the tumor border.
(more info).
|
Tissue invasion by ovary cancer cells, degrating first the basal membrane of the ovary and then the mesothelial layer. The
line represents the tumor border.
(more info).
|
|
|
|
|
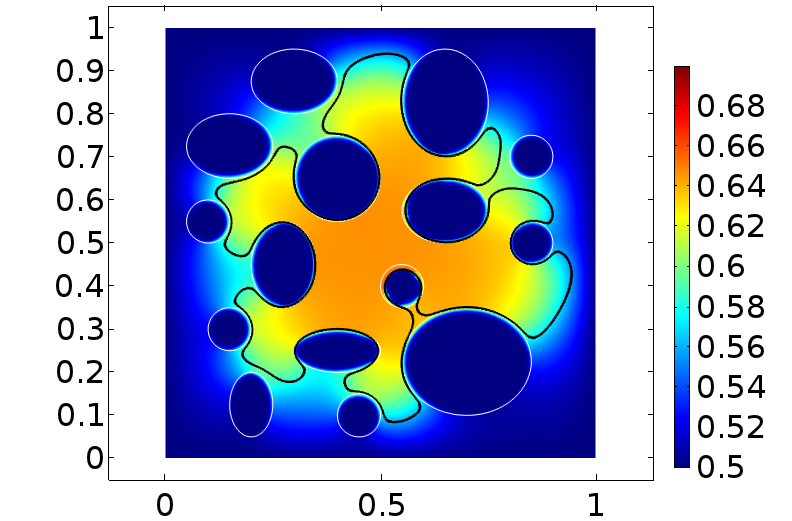
Growth of a tumor around three areas with too dense ECM and surface instability.
(more info).
|
Growth of a tumor in a heterogeneous tissue when the ECM fiber network in the elliptic areas still allows cells to pass through.
(more info).
|
Growth of a tumor in a heterogeneous tissue when the ECM fiber network in the elliptic areas still does not allow cells to pass through.
(more info).
|
|
Vascular Tumour Growth
Crescita Vascolare
|
|
|
|
|
|
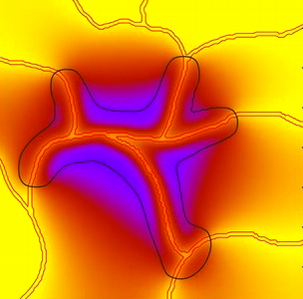
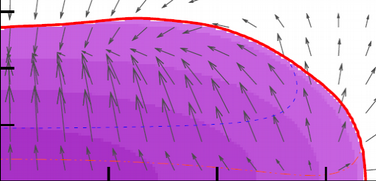
Growth of a tumor cord along a capillary on the x-axis. Distribution of oxygen. Cells in the blue
region are hypoxic. The line represents the tumor border.
(more info).
|
Growth of a tumor cord along a capillary on the x-axis. Volume ratio of tumor and host cells. The
line represents the tumor border.
(more info).
|
Tumor cord growth with aerobic and anaerobic populations. The starvation limits for the two
populations are identified by the dashed line. The thick line represents the tumor border.
Color/darkness shows the deficit of ATP for aerobic cells, i.e., the severity of hypoxia
(more info).
|
Volume fraction of anaerobic cells and tissue velocity. The starvation limits for the two populations
are identified by the dashed line. The thick line represents the tumor border
(more info).
|
|
Engineering Applications
Applicazioni ingegneristiche
|
|
|
|
|
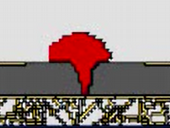
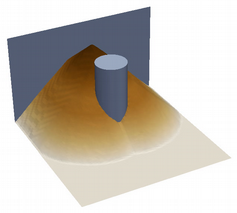
Growth of a pile of sand sedimenting from the rectangle between the wall and the column.
(more info).
|
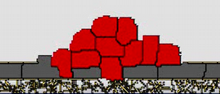
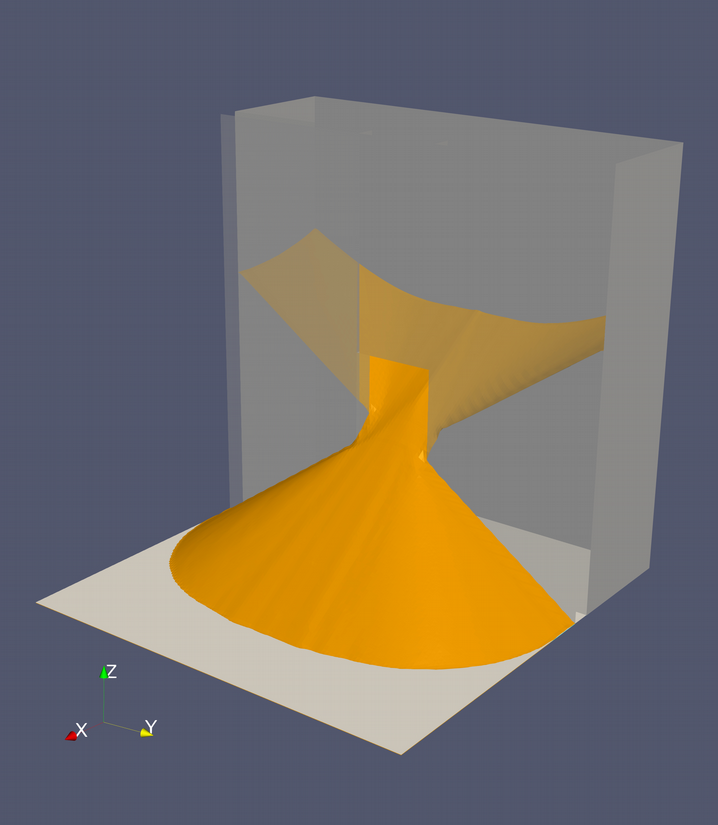
Growth of a pile of sand sedimenting in a room and exiting from its door.
(more info).
|
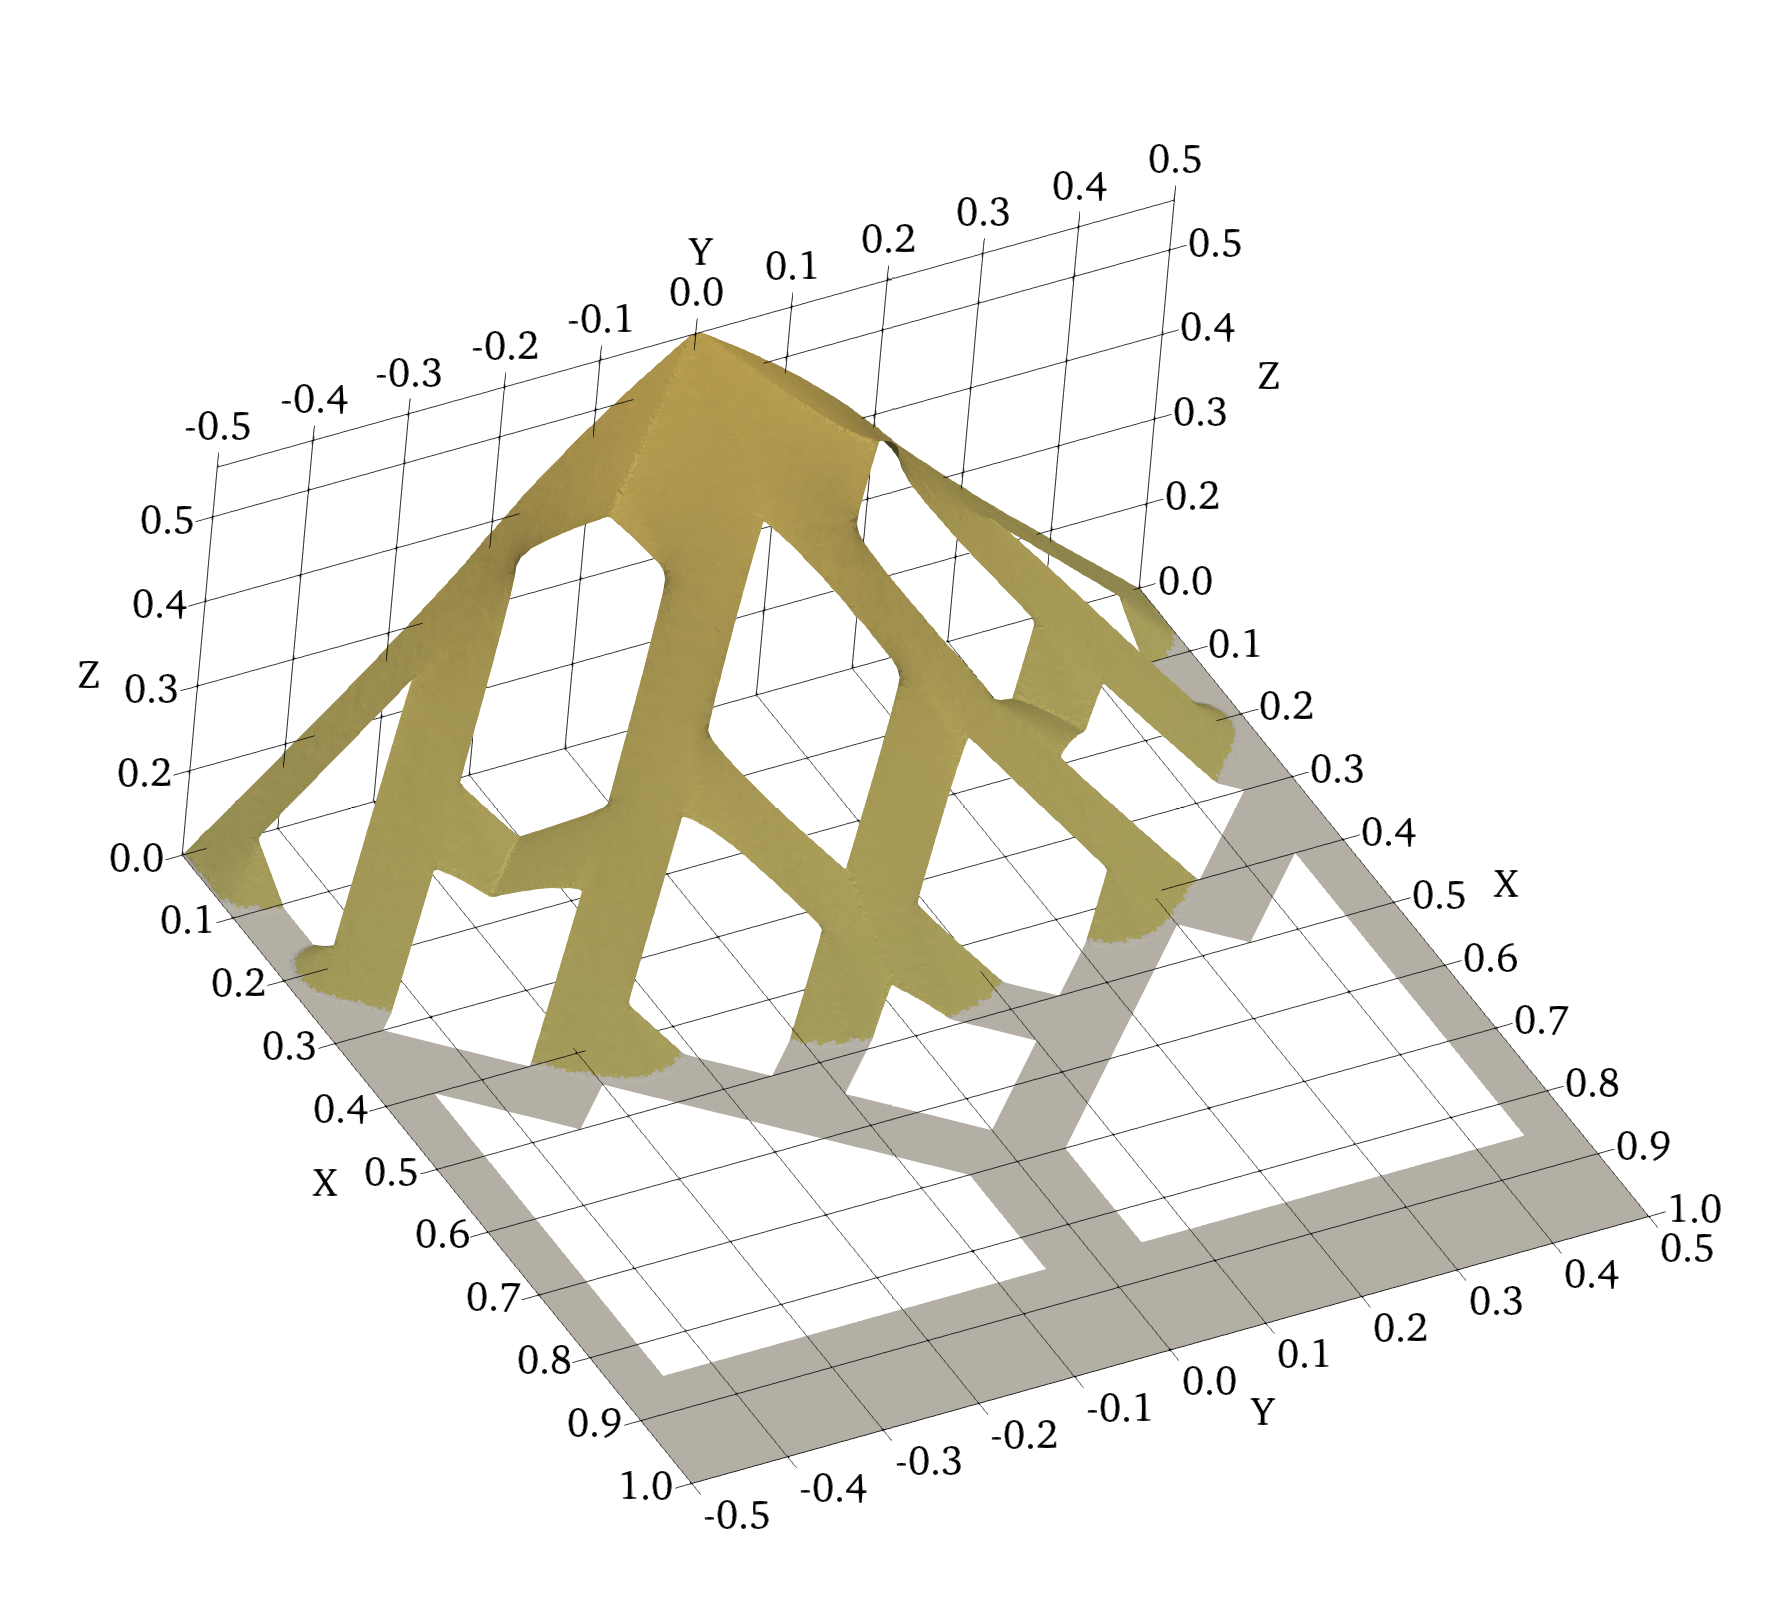
Redistribution of sedimenting sand in a network of corridors.
(more info).
|
|
|
|
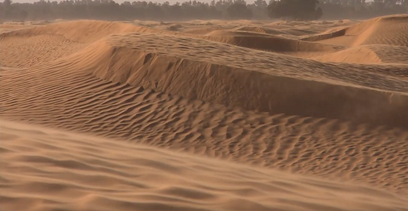
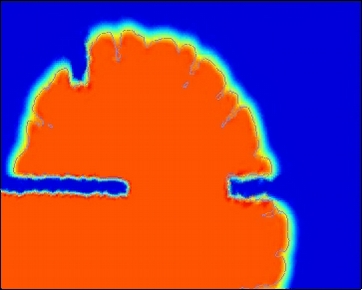
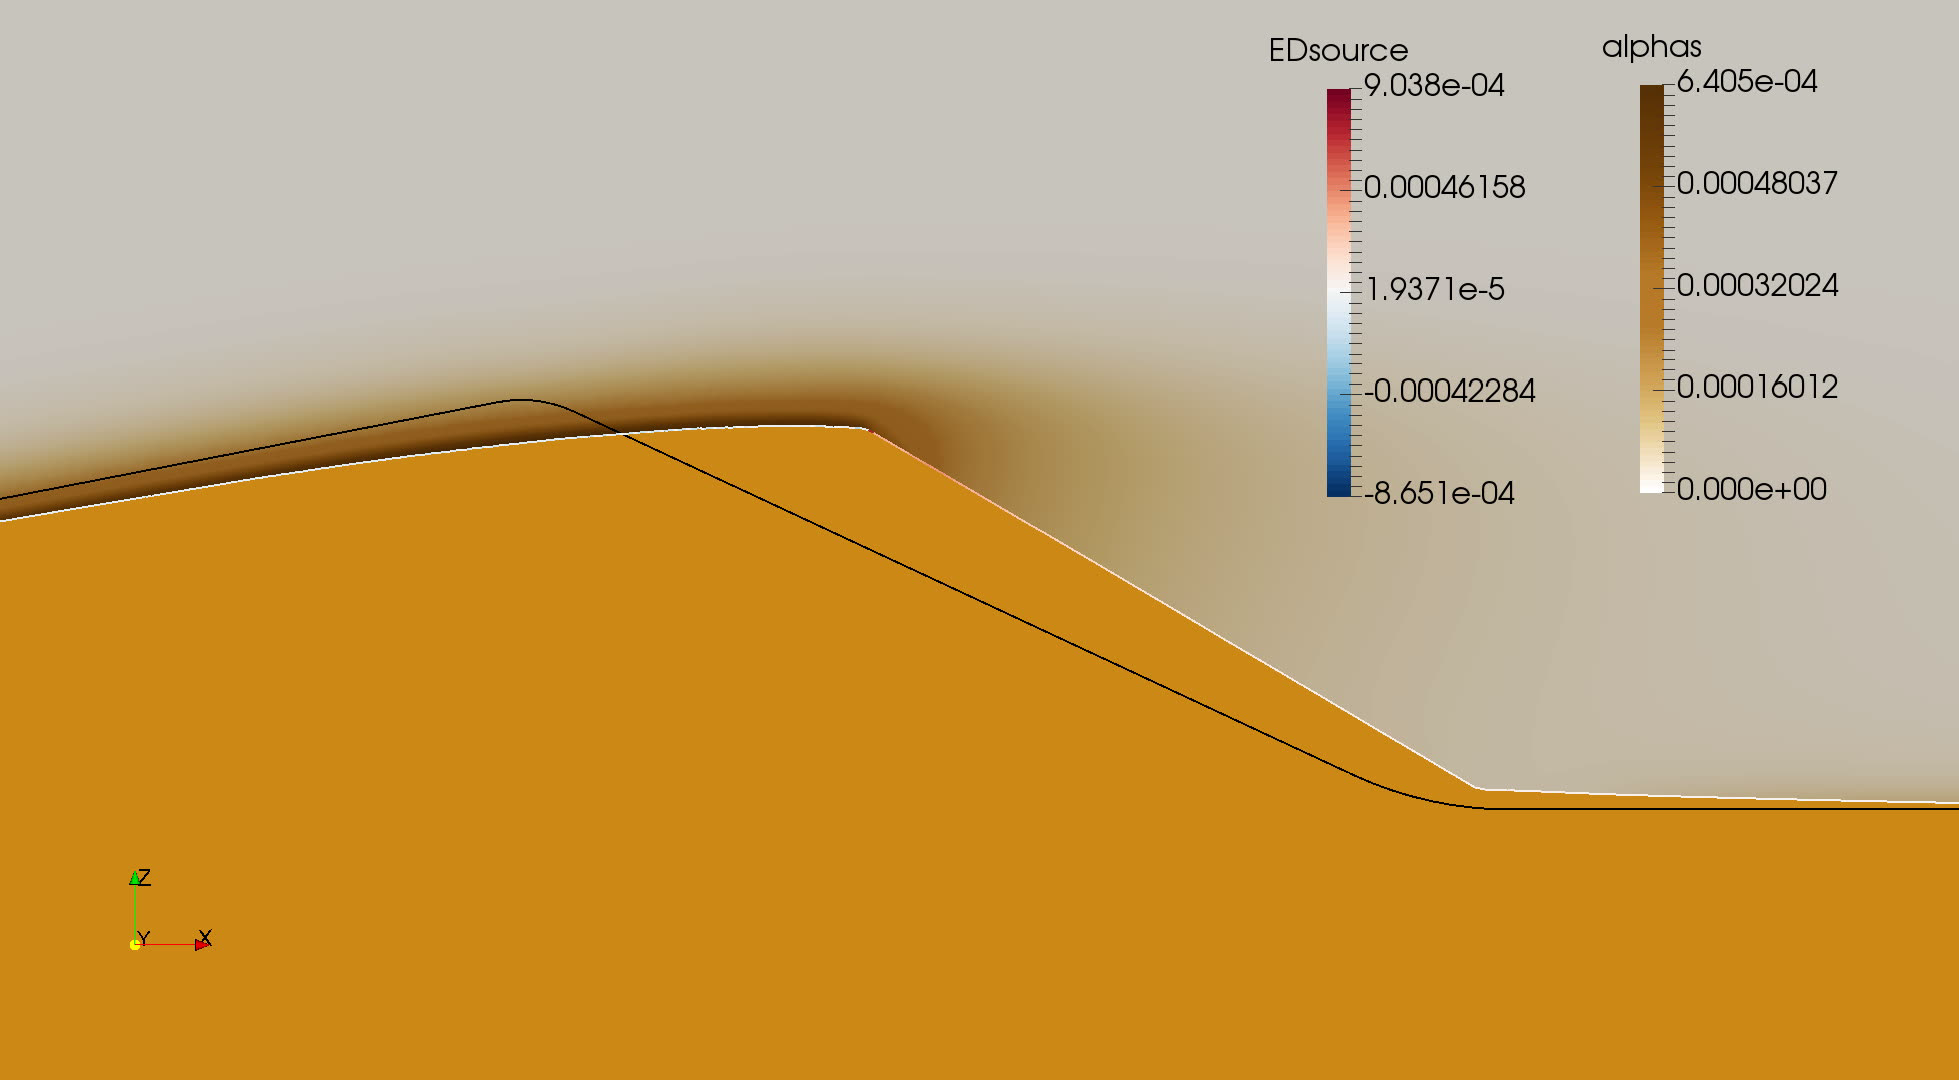
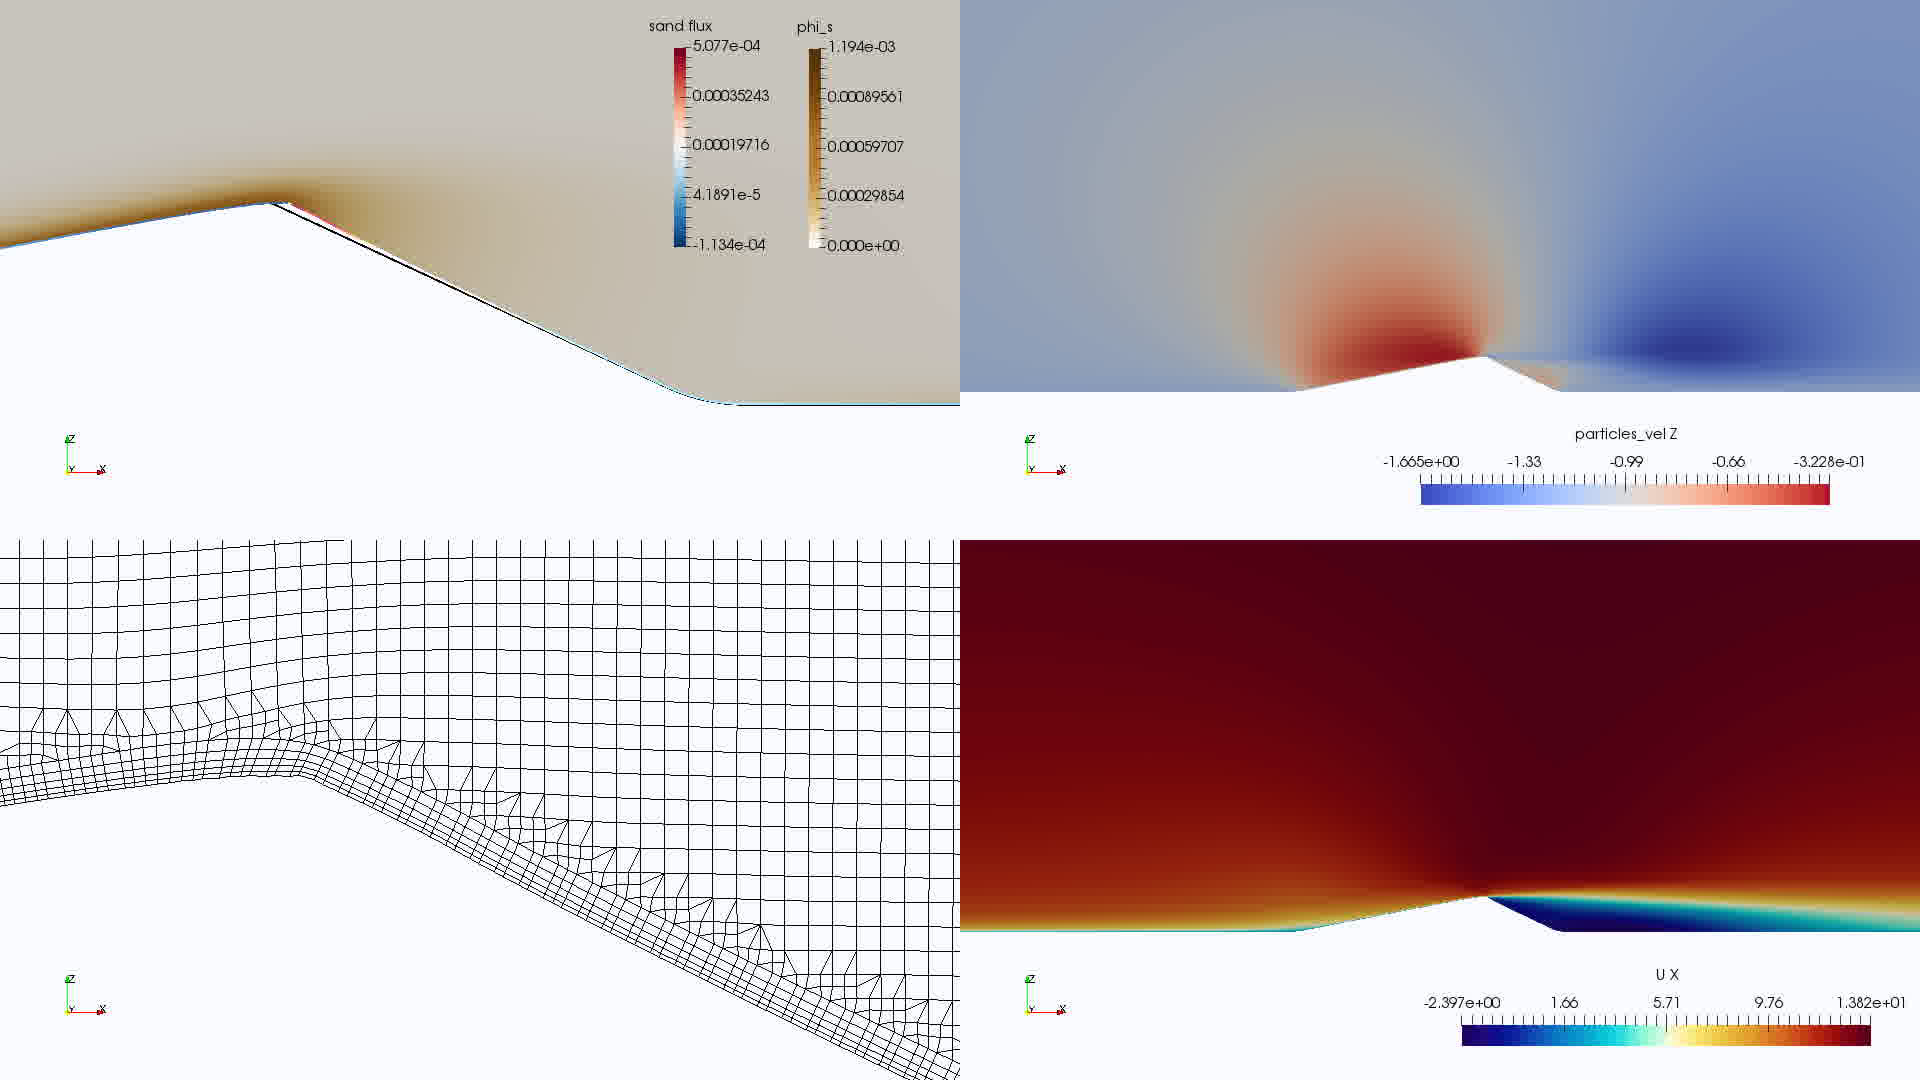
Simulation of the motion of a dune due to sand erosion and transport by the wind, deposition and avalanching.
(more info).
|
Erosion-transport-deposition model applied to transport of sand over a dune.
(more info).
|
|
|
|
|
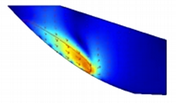
Simulation of an avalanche sliding down a curved slope.
(more info).
|
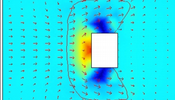
Impact of an avalanche on a building (top view).
(more info).
|
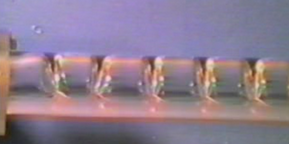
Instability of a viscous liquid (soybean oil) coating the inside of a rotating cylinder.
(more info).
|
