In the following you can find two papers on the use of image
processing in astronomy.
A comment on Eta Carinae’s
Homunculus Nebula imaging
Amelia Carolina Sparavigna, Department of Physics, Politecnico di Torino, Torino, Italy
Published at http://arxiv.org/abs/1005.4323
Homunculus
Nebula is
surrounding the star system Eta Carinae. The nebula is embedded within a much larger ionized hydrogen region,
which is the Carina Nebula. Homunculus is
believed to have been ejected in a huge outburst from Eta Carinae
in 1841, so brightly to be visible from Earth. This massive explosion produced
two polar lobes and an equatorial disc, moving outwards. Though Eta Carinae is quite away, approximately 7,500 light-years, it
is possible to distinguish in the nebula, many structures with the size of
about the diameter of our solar system. Knots, dust lanes and radial streaks
appear quite clearly in many images. In this paper, we compare the imaging of
Homunculus Nebula has obtained by HST and Gemini South Telescope research
teams. We use some processing methods, to enhance some features of the structure, such as the color
gradient, and knots
and filaments in the central part of the nebula.
Introduction
Space
telescopes and Earth-based telescopes with adaptive optics provide a huge
amount of data, that
after a subsequent image processing, are submitted for scientific analysis.
Using a combination
of many processing techniques, often including deconvolution methods,
researchers are creating very high resolution images of extended objects such
as nebulae. These images reveals so many details, that the researchers can try
to model the history of the nebula expansion. Even faint structures such as the
bow shocks created by stellar winds can appear in these images [1]. Let us
remember that the images we can see in the scientific literature and published
on the world wide web sites, are coming not only from an observation in the
visible range of radiation, but are often generated with filters at several
specific wavelengths. Resulting images are then composed
with a superposition of signals ranging from the infrared to the ultraviolet
radiation. This spanning of a large interval of wavelength has many advantages.
The infrared astronomy for example, with data coming from devices equipped with
infrared sensors, is able to penetrate the dusty regions of space, such as the
molecular clouds in nebulae, and detect the planets revolting about our
neighboring stars [2,3]. Moreover, the use of filters
gives information on the temperature of the observed structures.
Here we discuss
the benefit of a further image processing of astronomical images in enhancing
specific details in the images. The processing will be
applied on images of a specific object, the Homunculus Nebula of Eta Carinae. This nebula is embedded
within a much larger ionized hydrogen region, which is the Carina Nebula. The Homunculus is
believed to have been ejected in an outburst in 1841, so brightly to be visible
from Earth. This massive explosion produced two polar lobes and an equatorial
disk, which are moving outwards from the star [4,5].
We will show processed images, from the originals by the Hubble Space Telescope
(HST) and the Gemini South Telescope in
Eta Carinae and her little man
Eta Carinae’s Homunculus
(little man in Latin) is a bipolar nebula, where we see a pair of roughly spherical lobes expanding
at 650 km/s, that are connected to each other near the central star ([6] and
references therein). The equatorial plane orthogonal to the axis of the
Homunculus contains ejected material expanding from the core at up to 1500
km/s. The bipolar shape of the Homunculus nebulae could be attributed to an equatorial disc composed of
gas and dust, as in the case of butterfly nebulae [7], or due to the fact that
Eta Carinae is a binary star system, as recently
demonstrated [8]. Wikipedia is also reporting a theory that two small black
holes may be at the center of each lobe, one of which is consuming the
star.
The Homunculus
from Eta Carinae is actually one of the most studied
object, as the start itself. Eta Carinae is changing
its brightness, and currently is classified as a luminous blue variable binary
star. Wikipedia again reports the history of Eta Carinae
brightness. In April 1843, the star reached its greatest apparent brightness
and it was the second brightest star in the night-time sky after Sirius. About
the time of its maximum brightness, it is highly probable that Eta Carinae created the Homunculus. The approximate distance of
Eta Carinae is 7,500 light-years, that is quite away:
it is nevertheless possible to distinguish in the nebula many structures with
the size of about the diameter of the solar system [5]. The images show knots,
lanes and radial streaks originated from the star.
Homunculus
imaged by the Hubble Space Telescope
Many images of Homunculus can
be seen, obtained from the Hubble Space Telescope (HST). In fact one of the
early announcement about HST observations was on the resolution of individual clumps in the
Homunculus, with a size of about ten times the size of the Solar System,
obtained with the Wide Field and Planetary Camera. According to those
observations, the nebula was considered
as a thin and well defined shell of material, rather than a filled volume. Knots and filaments trace the locations of shock fronts within the nebula [9].
One of the best images is that
proposed by Jon Morse,
As reported in [6], using a
combination of image processing techniques, the researchers created one among
the highest resolution images of an extended object. The resulting picture is
so detailed that, even the nebulas is about 7,500 light-years away, structures
of about the diameter of our solar system can be distinguished. The Carina
Nebula was observed in September 1995 with the Wide Field Planetary Camera 2
(WFPC2). Images were taken through red and ultraviolet filters [10].
Taking advantage of the
spatial resolution of HST measurements, a two-dimensional map of the amount and
position angle of the polarization across the Homunculus was proposed
[11,12]. The data provide insight into
the three-dimensional distribution of dust about the star and in the
small-scale dust distribution on the lobes, which gives their cauliflower
appearance.
The HST observation clearly
confirms that the lobes are essentially hollow. One of the lobes is not a sphere, as it is possible
to see from a "flask" edge on its surface [6]. An excess violet light
escapes along the equatorial plane between the bipolar lobes. Apparently, there
is relatively little dusty debris between the lobes and most of the blue light
is able to escape. The lobes, on the other hand, contain large amounts of dust
which preferentially absorb blue light, causing their reddish appearance.
Fig.1.a shows the image as it
is from [10]. Applying a further image processing, the GIMP curve tool and GIMP
brightness-contrast tool, we find 1.b and 1.c respectively. These two images
are the best we can do with GIMP,
without loosing too many details of the central region. We have a better view
of the NW lobe and we see also some rays as whiskers originating from the central
star. Fig.1.d has been prepared with another tool, AstroFracTool,
to enhance the image edges, based on the use of the fractional gradient
[13,14]. The image obtained with AstrFracTool was
slightly adjusted with GIMP brightness-contrast tool. The final resolution of
this image is better than 1.b and 1.c. Image 1.d shows that the NW lobe has the
same cauliflower structure, with a protuberance resembling the flask shape of
the SE lobe.
The reader can see that rays
are originated from Eta Carinae and also from the two
stars at top left corner of the image (see 1.d). Probably, among the observed
long Homunculus' whiskers, there are some which are not properly represented or
even artificially created, because of the point-spread function of the instrumentation.
AstroFracTool is useful to enhance the
image edges, maintaining the image visibility. Pure edge detections can be
easily obtained with other processing methods, such as the Sobel
algorithm or the recently proposed dipole algorithm [15,16]: image 1.e is
obtained from 1.a with the GIMP Sobel tool whereas
image
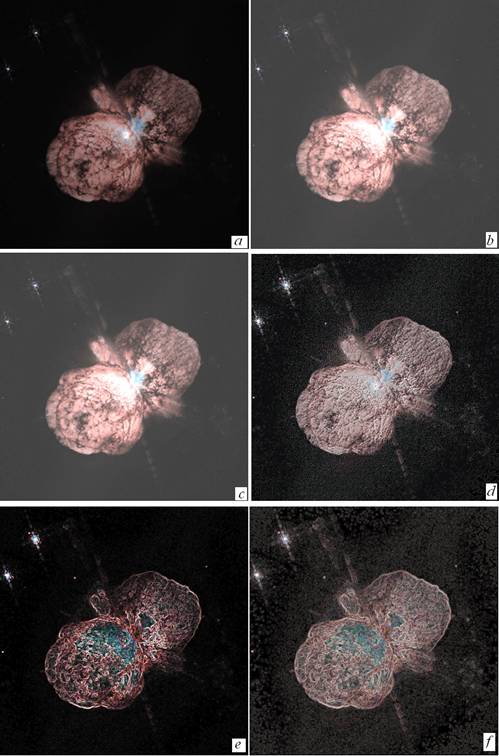
Fig.1 - 1.a shows the image as it is from ref.10. 1.b
and 1.c are obtained after using the GIMP curve and brightness-contrast tools.
These are the best results we can obtain, without loosing details of the
central region. 1.d is obtained enhancing the image edges with AstroFracTool and GIMP brightness-contrast tool. The
resolution of 1.d is better than that of
1.b and 1.c. Rays are originated from Eta Carinae and
from the two stars at the top left corner. Among Homunculus' whiskers, there
are some due to the point-spread function of the instrumentation. In the lower
part of the figure, 1.e and
Homunculus
imaged by the Gemini South Telescope
Fig.2.a shows Eta Carinae as imaged by the Gemini South telescope in
The Gemini image is due to the research
of John Martin and his team [19].
According to the researchers, the image displays a feature of the nebula never
directly imaged before, the Little
Homunculus, which is under the visible outer layer of the great outburst,
corresponding to the Homunculus. In early 2007, Eta Carinae revealed new
surprising features: the ground-based observations indicated that the star was
rapidly decreasing in brightness. As reported in [20], a chaotic variation in brightness
is possibly coming from viewing the star directly along the unstable boundary
between low and high latitude winds. For the study of Eta Carinae,
combined researches with Gemini South and HST were used to compare the spectra
in late June 2007 [20].
As previously done on the HST
image, we can try to apply a further image processing to the Gemini image. The
use of GIMP curve and brightness-contrast tools were not able to resolve
details: in fact, they strongly reduce the image quality. The use of AstroFracTool instead, is able to show many details. Images
2.b and 2.c were obtained with different fractional and visibility parameters
(ν=0.8, α=0.4 and ν=1.0,α=0.4, respectively, see Refs.13
and 14 for the meaning of these parameters). Note the pattern formed by the
debris of explosion between the lobes in
image 2.c. The shape of the NW lobe
looks different from the HST image but this is simply due to the fact that the
top right corner of the original image is cut.
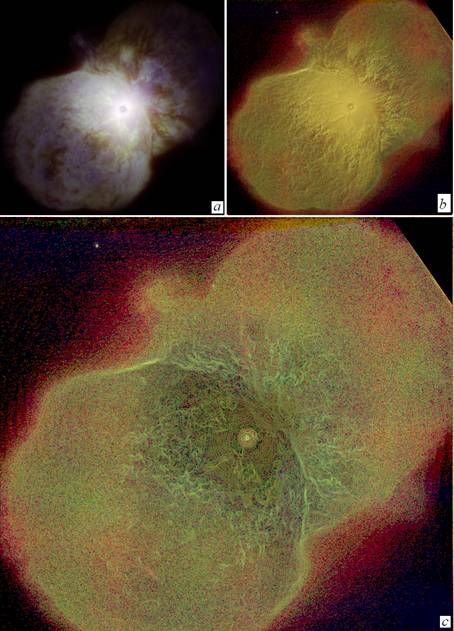
Fig.2 - 2.a shows the Homunculus imaged by the Gemini
South Telescope in
Comparing images
The shape of the lobes
is the same as imaged from HST and from Gemini. The “fan” on the NW lobe is
again visible in 2.b after enhancement (note the slight embossment effect of
the algorithm). The
detail of the laced structures of lobes
is actually reduced in the Gemini image: nevertheless, the SE lobe has
the "flask" edge on its surface, as clearly shown by image 2.b.
In the lower part of figure,
in image
2.c, it is possible to note many rings, concentric with the star, probably due
to spread function of the instrumentation. HTS and Gemini instruments have two
different point-spread functions and then, after the processing deconvolution
methods have been applied to the relative images, the two systems give us an imaging
of the central whiskers with different features, long and straight in the HST
imaging, as curly hair in the case of the Gemini imaging.
We could ask ourselves whether
a quantitative comparison of structures shown in HST and Gemini images is possible or not. In
fact, these images are probably obtained from data recorded during quite
different periods of time, and the variations in brightness of the star, which are not negligible, as well
as the motion of the nebula itself, deeply affect the final result of any
comparison. Moreover, each instrument has its specific function affecting the
final rendering.
It is not easy then to answer
positively or negatively. Here, we show just a possibility based on the use of
edge detection algorithms to find reference structures. First of all, we need to enhance knots and
filamentary structures in the Gemini original image. The upper part of
Fig.3 is obtained using the color dipole
method to enhance the edge. In this case, the method is applied on the image
corresponding to the green tones. In the lower part, we report an HST image, adapted
from a figure in Ref.6. The reader can observe some knots that seem to
correspond in both images encircled in red. Assuming these knots as reference
points, we observe that several filamentary structures seems to correspond too.
Note that in Fig.3 the dipole edges of the Gemini images are compared to the
structures shown by the original image from HST, not with its dipole edges.
Fig.1 and Fig.2 separately show that
a further image processing can be suitable to enhance specific details in the
original images. For comparing the images, we have seen through Fig.3 that the
edge detection algorithm is a good starting point to develop a successful
method. In spite of the quite different appearance of images obtained with
different instrumentation, the use of edge enhancement reveals some specific
details that can be seen as reference points. After identifying some of these reference points, it
seems more easy to recognize the structures passing from one image to the
other.
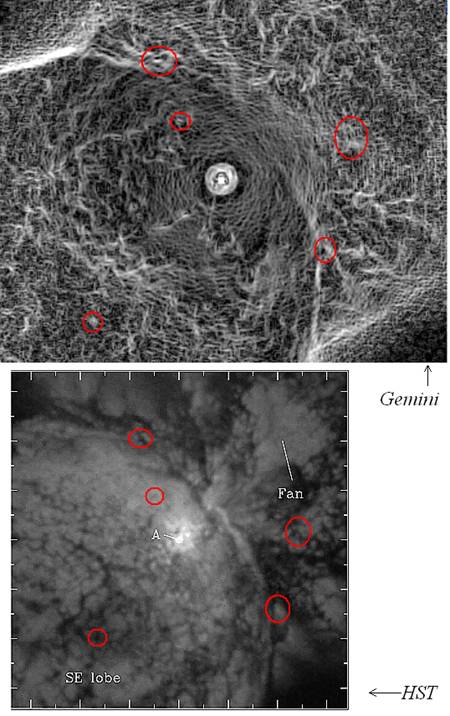
Fig.3 –
Using the dipole algorithm on the green tones of the Gemini image, we can compare it with an
image from HST (adapted from Fig.5 in Ref.6). In spite of the quite different
appearance of the original images obtained with a different instrumentation, we
can see many knots that seem to correspond in both
images. These knots are encircled with red.
References
1) A.C. Sparavigna,
R. Marazzato, Observing stellar bow shocks, arXiv:1005.1527, Space Physics and
Galaxy Astrophysics, 2010.
2) C. Marois, B. Macintosh, T. Barman, B.
Zuckerman, I. Song, J. Patience, D. Lafreniere, R.
Doyon, Direct imaging of multiple planets orbiting the star HR 8799, Science, Vol322, pp.1348-1352, 2008.
3) I. Song, G. Schneider, B. Zuckerman, J. Farihi,
E.E. Becklin, M.S. Bessell,
P. Lowrance, B.A. Macintosh, HST NICMOS imaging of
the planetary-mass companion to the young brown dwarf 2MASSW J1207334_393254, The Astrophysical
Journal, Vol.652, pp.724Y729, 2006.
4) R.M. Humphreys, Eta Carinae, The
Observational Story, 1600 to 2004, ASP Conference Series, Vol. 332, ed. R.M
Humphreys, K. Stanek, Astronomical Society of the
Pacific, San Francisco, 2005.
5) K. Davidson, Basic Parameters of Eta Carinae,
ASP Conference Series, Vol.179, ed. J.A. Morse, R.M. Humphreys, A. Damineli, Astronomical Society of the Pacific, San
Francisco, ISBN 1-58381-003-X, 1999.
6) J.A. Morse, K. Davidson, J. Bally, D. Ebbets,
B. Balick, A. Frank, Hubble Space Telescope Wide
Field Planetary Camera 2 Observations of Eta Carinae,
The Astronomical Journal, Vol.116, pp.2443-2461, 1998.
7) G.A. Gurzadyan, The physics and dynamics of
Planetary Nebulae,
8) N. Neal-Jones, B. Steigerwald, NASA
satellite detects massive star partner,
9) J. Hester, NASA's Hubble Space Telescope resolves eruption of a
massive star, STScI-1991-10, 1991.
10) http://hubblesite.org/newscenter/archive/releases/1991/1991/10/image/a/
11) R.E. Schulte-Ladbeck, A. Pasquali, M. Clampin,
A. Nota, J. Hillier, O.L. Lupie,
Imaging polarimetry of Eta Carinae
with the Hubble Space Telescope, Lecture Notes in Physics, Vol. 523,
pp.255-259, Springer Berlin – Heidelberg, 1999.
12) N.L. King, A. Nota, J.R.
Walsh, N. Panagia, T.R. Gull, A. Pasquali,
M. Clampin, L.E. Bergeron, A Hubble Space Telescope
polarization study of dust in the Eta Carinae
Homunculus, The Astrophysical Journal, Vol.581, pp.285–306, 2002
13) A.C. Sparavigna,
P. Milligan, Using fractional
differentiation in astronomy, arXiv:0910.4243, Instrumentation and Methods for Astrophysics, 2009.
14) R. Marazzato,
A.C. Sparavigna, Astronomical image processing based on fractional
calculus: the AstroFracTool, arXiv:0910.4637, Instrumentation
and Methods for Astrophysics, 2009.
15) A. Sparavigna, Color dipole moments for edge detection, arXiv:0904.0962, Computer Vision and Pattern Recognition, 2009.
16) A. Sparavigna, Dipole and quadrupole
moments in image processing, arXiv:0902.4073, Computer Vision and Pattern Recognition, 2009.
17)
http://www.gemini.edu/gallery/v/Previous-Featured-Images/Eta_car_Final_8bt.jpg.html
18) P. Michaud, J. Martin, Revealing the explosive heart of Eta Carinae,
www.gemini.edu/
node/11384, 2010.
19) Gemini Team, J. Martin, E. Artigau, K. Davidson, R. Humphreys, O. Chesneau,
N. Smith.
20) J.C.
Martin, K. Davidson, R.M. Humphreys, K. Ishibashi, M.
Koppelman, O. Stahl, N.B. Suntzeff, N. Walborn, What happened to Eta Carina in early 2007?, 211th AAS Meeting in Austin,
http://www.gemini.edu/images/stories/websplash/ws2007-28/59.04.pdf
___________________________________________________________________________________________________
Astronomical image processing based
on fractional calculus: the AstroFracTool
by Roberto Marazzato and Amelia Carolina Sparavigna (Department of Physics, Politecnico di Torino, Torino, Italy)
published at http://arxiv.org/abs/0910.4637
The
implementation of fractional differential calculations can give new
possibilities for image processing tools, in particular for those that are
devoted to astronomical images analysis. Fractional differentiation is able to
enhance the quality of images, with interesting effects in edge detection and
image restoration. Here, we propose the AstroFracTool,
developed to provide a simple yet powerful enhancement tool-set for
astronomical images. This tool works evaluating the fractional gradient of an
image map. It can help produce an output image useful for further research and
scientific purposes, such as the detection of faint objects and galaxy
structures, or, in the case of planetary studies, the enhancement of surface
details.
Introduction
Digital images are arrays of numbers that can be manipulated by computer
software. Using for instance the RGB colour model, that is, the additive colour
model in which the addition of red, green and blue lights reproduces the
colours, we associate to each pixel of the image three numbers ranging form 0
to 255, the colour tones. We can then prepare a code in a programming language
to analyse this array of numbers and prepare an output map corresponding to our
specific desired evaluations.
There are many image processing resources, most of
them freely available and quite friendly to use, which can be useful in
manipulating images. In spite of this abundance, the development of new methods
and tools is still worthy of efforts. Here, we propose the AstroFracTool,
developed to provide an enhancement tool-set for astronomical images. This tool
works evaluating the fractional gradient of an image map, that is, it works by
means of a fractional differentiation. Let us note that, to the authors’
knowledge, none among
the free digital imaging software packages uses routines based on fractional
calculus.
Fractional calculus provides
derivation and integration of functions to non-integer order [1-3]. The problem
is rather old, as shown by a correspondence between Leibniz and L’Hopital [4]. The fact that we are not familiar with
fractional calculus is due to its development in the field of pure mathematics
[5]. First applications were proposed in 1920. Only recently, it was approached
in image processing [6], where it can be rather interesting for filtering and
edge detection [7-9]. As proposed in [7] and discussed in [10], fractional
differentiation is suitable for edge detection and for enhancing the image
quality. In [11], the fractional differentiation was used for processing
astronomical images.
The recording of astronomical images
is characterised by very long exposure times, often of many hours, or on the
recording a movie. The image is prepared stacking many frames of the
sequence. Long time exposure photography suffers from many sources of noise,
due to surface lights and flickering of atmosphere. This noise remains recorded
in the resulting image. In the case that a stacking procedure is used, the
level of noise increases when each image is stacked on [11]. Removing the noise
has the consequence to deplete the image of detail and then, in the final
image, faint objects are fainter and edges are smoother.
As discussed in
[10,11], fractional differentiation can help scan and examine an astronomical
image: there, images were processed with a Fortran code running on a Unix
machine. Here we propose the package AstroFracTool
as the toll, suitable to improve the astronomical images, running on Windows.
The
algorithm
AstroFracTool is based on the discrete implementation of the fractional gradient as
in Ref.[12,13]. Let ![]() be a real number. The fractional gradient is defined as in
Ref.[13].
be a real number. The fractional gradient is defined as in
Ref.[13].
AstroFracToll evaluates the magnitude
of gradient ![]() of the image map
of the image map ![]() for each colour tone
for each colour tone ![]() . For each colour, we find the maximum value
. For each colour, we find the maximum value ![]() on the image map. After we define the output map as in the
following:
on the image map. After we define the output map as in the
following:
where ![]() is a parameter suitable to adjust the image contrast.
is a parameter suitable to adjust the image contrast.
The
role of ![]() parameters in the image processing is illustrated in Fig.1:
note that it is possible to see more details near the
edges and inside craters. In Fig.2, we see another example with a
galaxy image; in this case, parameter
parameters in the image processing is illustrated in Fig.1:
note that it is possible to see more details near the
edges and inside craters. In Fig.2, we see another example with a
galaxy image; in this case, parameter ![]() was
set to a fixed value.
was
set to a fixed value.
The
algorithm enhances image edges turning out to be useful in studying images with
faint grey- or colour tone variations. Therefore, the tool reveals faint
objects in the image, increasing then possibilities to discover small erratic
bodies. Let us remember that fractional differentiation behaves
differently from that of integer derivatives and then the results we can obtain
by applying the fractional gradient are different from those obtained by means
of usual image processing tools, such as GIMP, for instance. These programs in
fact have filtering actions based on integer order differentiation. GIMP and
other tools are suitable for a further processing of the map obtained from
fractional gradient evaluation, to have an enhancement of colours, brightness
and contrast
AstroFracTool features
AstroFracTool has been
developed to provide a simple enhancement tool-set. As previously told,
its first release is based on the fractional gradient concept. The tool is
working on any BMP or JPG picture of sky objects. The package runs on Windows
NT/2K with a .NET package, which can be downloaded free from the MS site.
GUI
The interface is quite simple: it is possible
to open a selected image and set the processing parameters (screenshot #1) and
choose the image to be displayed (screenshot #2). It is possible to
create an HTML report (the use of which is strongly suggested for recording
purposes), as the one which is displayed at http://staff.polito.it/roberto.marazzato/pleiades
(screenshot #3), editing the most relevant data of the last report.
Features to be added
Here we are discussing and working with the
first trial version of AstroFracTool. New
features will be added soon. The next one is being theoretically analysed, and
will allow the user to control each separate colour channel both in the
horizontal and in the vertical direction. Suggestions from astronomers, to
improve the software according to the needs of the intended users, will be very
useful to prepare the new versions.
Availability
AstroFracTool can be freely downloaded at the following URL: http://staff.polito.it/roberto.marazzato/AstroFract.zip
.
Examples
and discussions
With AstroFracToll we are able to detect the faint
stars in the image background. A proposed application for the program could
a use for detection of erratic bodies such as comets or asteroids by comparing
images of the same region of space. In the upper part of Fig.3, (3.a) is
showing the original image, (3.b) and (3.c) the maps obtained with the
fractional gradient. The lower part of the figure shows the same images,
processed with GIMP, with increased brightness and contrast. Note that image
(3.d) is the best result that we can obtain with GIMP.
Being dependent on local tone variations, the
application of a fractional gradient to an image is able to enhance galactic
structures, which are depending on the density matter variation. Two examples
are shown in Fig.4 and 5. AstroFracTool
increases both stars and galactic structure visibility. The output image
obtained by the software can be improved by increasing brightness and
contrast. This further processing does not add or remove information.
When brightness and contrast of the input image, which is of the original
image, are changed, we often find that some information is lost. For instance,
we try to increase the brightness and improve the contrast to have a better
stars visibility, but we have, at the same time, that galactic details are
removed. Because of processing several astronomical images, we suggest
that fractional differentiation could properly enter those image-processing
tools devoted to the detection of faint objects in astronomical images.
We have tested the first trial version of AstroFracTool. Future works are needed,
improving the algorithm with new possibilities. As previously told, an
interesting processing feature could be the separate control of colour
channels; another one could be the comparison of images (addition and
subtraction of images). As a matter of fact, the use of this tool by
astronomers will be very useful to prepare the new versions.
ACKNOWLEDGEMENT
Authors thank Paul Milligan of the British
Astronomical Association, Isle of Man Astronomical Society (http://www.eyetotheuniverse.com/), for interesting
discussions and suggestions.
REFERENCES
[1] M. Kleinz
and T.J. Osler, A Child’s Garden of Fractional Derivatives, The College
Mathematics Journal, 31(2), 2000, pp. 82–88, www.maa.org/pubs/calc_articles/ma021.pdf
[2] P.L. Butzer
and U. Westphal, An introduction to factional
calculus, in Applications of Fractional Calculus in Physics (Ed. R.Hilfer).
[3] A.A. Kilbas, H.M. Srivastava and J.J. Trujiilo,
Theory and applications of fractional differential equations, Amsterdam,
Elsevier, 2006.
[4] G. Baumann, Fractional Calculus and Symbolic
Solution of Fractional Differential Equations, in “Fractals in Biology and
Medicine”, Birkhäuser Basel, 2005. Pp. 287-298
[5]
D. Cafagna, Fractional calculus: a mathematical toll
from the past for present engineering, IEEE Indutrial
Electronic Magazine, Summer 2007, pp.35-40, 2007.
[6] M.D. Ortigueira
and J.A. Tenreiro Machado, Fractional signal
processing and applications, Signal processing, 83, pp.2285-2286, 2003.
[7] B. Mathieu, P. Melchior, A. Oustaloup, Ch. Ceyral, Fractional
differentiation for edge detections, Signal Processing, 83, pp.2421-2432, 2003
[8] J. You, S. Hungnahally
and A Sattar, Fractional discrimination for texture
image segmentation, International Conference on Image Processing
(ICIP'97) - Volume 1, pp. 220-223, 1997.
[9] J.M. Blackledge, Diffusion and fractional diffusion based image
processing, EG UK Theory and Practice of
Computer Graphics, pages: 233 - 240,
[10] A.C. Sparavigna,
Fractional differentiation based image processing, Computer Vision and Pattern
Recognition (cs.CV), arXiv:0910.2381v2, 2009.
[11] A.C. Sparavigna and P. Milligan,
Using fractional differentiation in astronomy, Instrumentation and Methods for Astrophysics (astro-ph.IM), arXiv:0910.4243,
2009
[12] Jia Huading and Pu Yifei, Fractional calculus method for enhancing digital
image of bank slip, Proceedings of the 2008 Congress on Image and Signal Processing,
Vol. 3, pp.326-330, CISP’2008, 2008.
[13] Y. Pu, W.X. Wang, J.L. Zhou, Y.Y. Wand
and H.D. Jia, Fractional differential approach to
detecting textural features of digital image and its fractional differential
filter implementation, Sci. China Ser. F Inf. Sci., 51(9), pp.1319-1339,
2008.
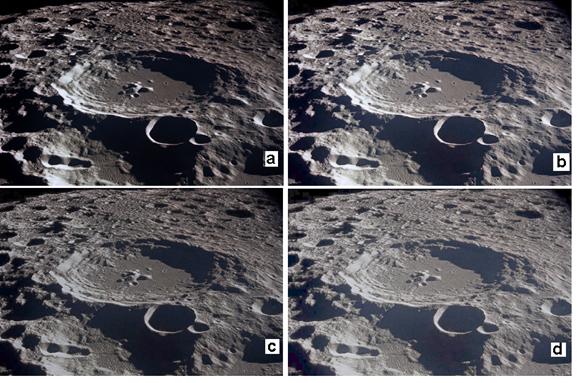
Figure 1. The figure shows
the role of ![]() parameters
in the image processing. The original image (a), taken by Apollo 11, shows Moon
craters. Image (b-d) are the maps obtained by means
of the AstroFracTool with: (b)
parameters
in the image processing. The original image (a), taken by Apollo 11, shows Moon
craters. Image (b-d) are the maps obtained by means
of the AstroFracTool with: (b)![]() , (c)
, (c) ![]() and
(d)
and
(d) ![]() . The original
image is obtained again when
. The original
image is obtained again when ![]()
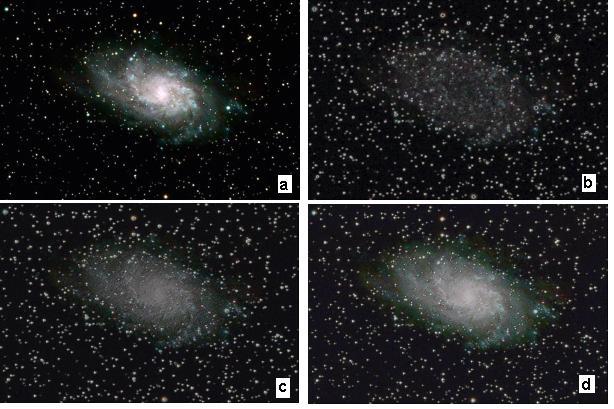
Figure 2. Image (a) shows
Messier 33 (Triangulum galaxy, author: Paul Milligan, http://www.eyetotheuniverse.com/). (b), (c) and (d) are the maps obtained with ![]() ,
, ![]() and
and ![]() respectively.
For the three images, we have set
respectively.
For the three images, we have set ![]() . See
[11] for more details.
. See
[11] for more details.
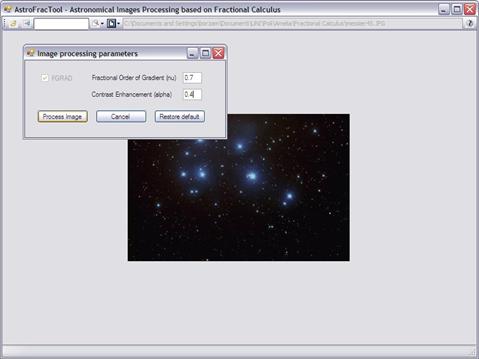 Screenshot 1
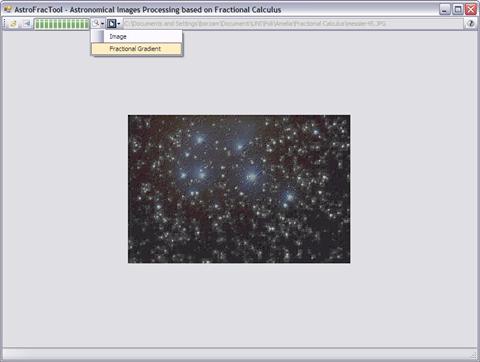 Screenshot
2
Screenshot
2
 Screenshot
3
Screenshot
3
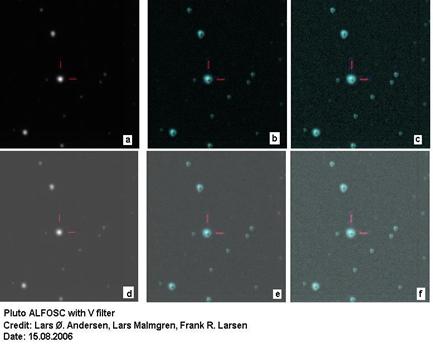
Figure 3. In the upper part of Fig.2,
(a) is showing the original image, (b) and (c) the maps obtained with the
fractional gradient. (b) has ![]() and
(c)
and
(c) ![]() . The lower part
of the figure shows the same images, processed with GIMP, to increase
brightness and contrast. Note that image (d) is the best result that we can
obtain with GIMP. The original image is published by the Nordic Optical
Telescope Scientific Association, authors L.Ø. Andersen, L.Malmgren,
F.R. Larsen.
. The lower part
of the figure shows the same images, processed with GIMP, to increase
brightness and contrast. Note that image (d) is the best result that we can
obtain with GIMP. The original image is published by the Nordic Optical
Telescope Scientific Association, authors L.Ø. Andersen, L.Malmgren,
F.R. Larsen.
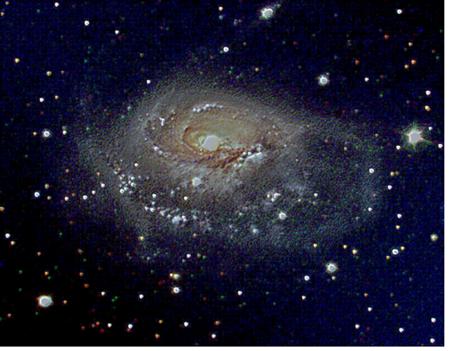
Figure 4. AstroFracTool image, with a subsequente GIMP adjustment, obtained from an image
of NGC1961 galaxy (Nordic Optical Telescope Scientific Association, Jyri Näränen and Kalle Torstensson).
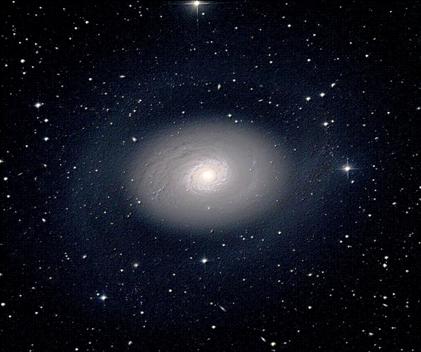
Figure 5. AstroFracTool image, with a subsequente
GIMP adjustment, obtained from an image of M94 galaxy, by Hillary Mathis,
N.A.Sharp/NOAO/AURA/NSF.
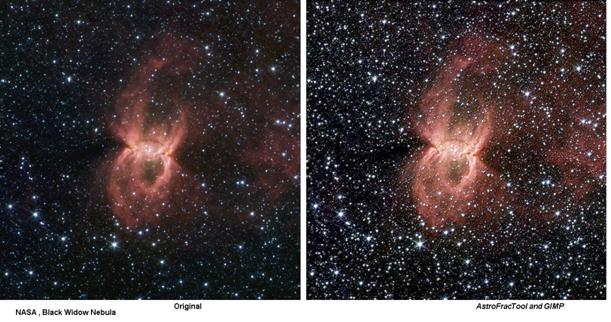
Fig.6.
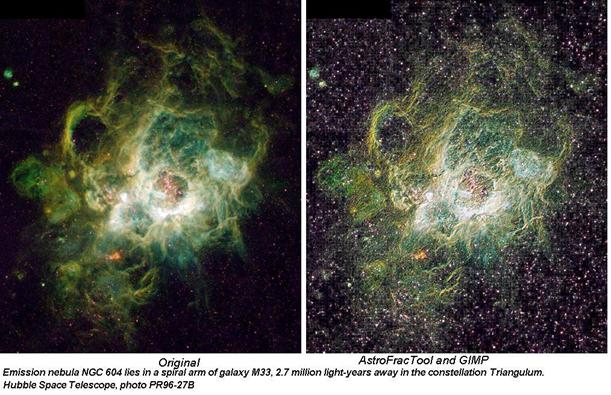 Fig.7
Fig.7
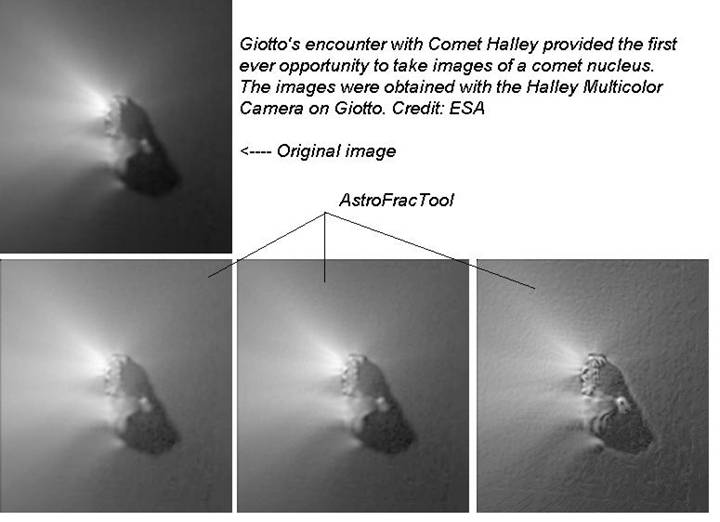 Fig.8
Fig.8
You can also
see a movie the Halley comet. It is obtained by means of several images developed with AstroFracTool and
different values of parameters.